Indexing, Manipulation and Visualization of data - Part 2

Day 4 Indexing, Manipulation and Visualization of data - Part 2

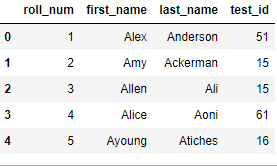
Now let us use the merge().
merge() is some what related to the joins in SQL, so if you google about the joins in SQL it is very easy for you to grasp these things quicker.
Ok look at these tables and we are going to merge these tables using different join operations
While we should create those data frames
df_a = pd.DataFrame({        'roll_num': ['1', '2', '3', '4', '5'],        'first_name': ['Alex', 'Amy', 'Allen', 'Alice', 'Ayoung'],         'last_name': ['Anderson', 'Ackerman', 'Ali', 'Aoni', 'Atiches']})
df_b = pd.DataFrame({        'roll_num': ['4', '5', '6', '7', '8'],        'first_name': ['Billy', 'Brian', 'Bran', 'Bryce', 'Betty'],         'last_name': ['Bonder', 'Black', 'Balwner', 'Brice', 'Btisan']})
df_c = pd.DataFrame({ 'roll_num': ['1', '2', '3', '4', '5', '7', '8', '9', '10', '11'], 'test_id': [51, 15, 15, 61, 16, 14, 15, 1, 61, 16]})| roll_num | first_name | last_name |
|---|---|---|
| 1 | Alex | Anderson |
| 2 | Amy | Ackerman |
| 3 | Allen | Ali |
| 4 | Alice | Aoni |
| 5 | Ayoung | Atitches |
| roll_num | first_name | last_name |
|---|---|---|
| 4 | Billy | Bonder |
| 5 | Bryan | Black |
| 6 | Bran | Balwner |
| 7 | Bryce | Brice |
| 8 | Betty | Btisan |
| roll_num | test_id |
|---|---|
| 1 | 51 |
| 2 | 15 |
| 3 | 15 |
| 4 | 61 |
| 5 | 16 |
| 7 | 14 |
| 8 | 15 |
| 9 | 1 |
| 10 | 61 |
| 11 | 16 |
Using these dataframe we'll try to use basic join operation, inner, left, outer, right.
Try this code snippets , please put import statements by yourself
pd.merge(df_a, df_c, on='roll_num')
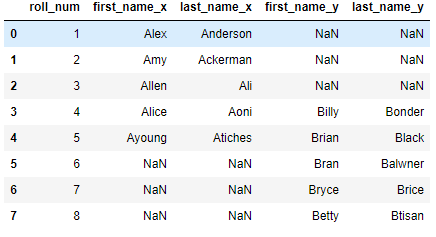
pd.merge(df_a, df_b, on='roll_num', how='outer')
pd.merge(df_a, df_b, on='roll_num', how='inner')

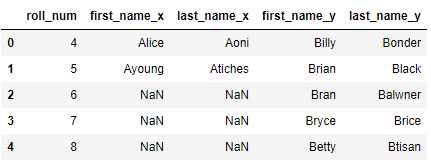
pd.merge(df_a, df_b, on='roll_num', how='right')

And that one also can be changed by changing axes value.
Note:
Check this link for the pandas functions and uses , you can navigate to all functions, their attributes and their values.
Well now we will look how to visualize the data using visualization tools
Oh! wait one minute, how did I forget this one ,
You can use apply() function which was often you are going to use in Data Manipulation.
This is very similar to for loop, as we use the keywords to access the data according to our requirement.
Let me share the codes with you , try it yourself. And also try with different datasets, data sets can be downloaded from Kaggle or in google.
import pandas as pdimport numpy as np
data_BM = pd.read_csv('data.csv')# drop the null valuesdata_BM = data_BM.dropna(how="any")# reset index after droppingdata_BM = data_BM.reset_index(drop=True)# view the top resultsdata_BM.head()
# accessing row wisedata_BM.apply(lambda x: x)
# access first rowdata_BM.apply(lambda x: x[0])
# accessing column wisedata_BM.apply(lambda x: x, axis=1)
# before clippingdata_BM["Fare"][:5]
# clip fare it is greater than 50def clip_price(price):    if price > 50:        price = 50    return price
# after clippingdata_BM["Fare"].apply(lambda x: clip_price(x))[:5]
data_BM["Embarked"][:5]
# label encode type def label_encode(type):    if type == 'C':        label = 0    elif type == 'S':        label = 1    else:        label = 2    return label
# operate label_encode on every row of Outlet_Location_Typedata_BM["Embarked"] = data_BM["Embarked"].apply(label_encode)
# after label encodingdata_BM["Embarked"][:5]
Post a Comment
Post a Comment
your response will be validated and get a reply very soon.